What is craniosacral rhythm and what is it for?
Source: http://craniosacral-app.com/app/why%20craniosacral.html by Patrick Botte, the lead programmer behind the iTHRVE app
Craniosacral rhythm affects the central nervous system by improving the function of your entire body.
iTHRVE app displays your craniosacral rhythm in real time and helps you to interact with it via your breathing.
In nature, all living things are created by embedding in cycles and waves. There are waves outside our body: like seasons, circadian rhythm, moon cycle… But there are also waves inside our body: brain waves, heart waves, breathing waves… All these external and internal waves interact with each other. As nature is neither uniform nor linear, it is not possible to represent or interpret nature as a set of linear waves (some winters can be longer or colder than others …). Therefore we can not represent nature as a perfect linear sine wave, but rather in the form of a wave which is waving:
Example of 4 minutes of recording of a pressure wave inside our body
According to Irving DARDIK “Waves move only within waves and contain waves, as an inherent continuum of wave motion in wave motion”.

a wave waving in another wave
Let’s take our cardiorespiratory system. When you breath in, your heart rate grows up;
and when you breath out, your heart rate decreases.
Watch Dan Winter and Patrick Botte talking about how iTHRVE app measures craniosacral rhythm below…
In this example below, cardio pulses (a) variation is first represented as a wave (b) whose frequency varies with time. If we draw the curve corresponding to Heart Rate Variability (c), the two curves are linked to each other (d). The increase of the frequency of the first curve (the red curve corresponding to heart pulses) induces the amplitude of the HRV curve (blue curve). The two curves are interdependent and can not anymore be represented in a linear way.
In this non linear model of waves waving within waves, each of the waves influence the other: slow waves influence more rapid waves and high frequency waves influence low frequency waves.
This is the reason why induced slow breathing rates practice affects the amplitude of our internal heart rate, increases our vitality and makes us much more healthy.
CranioSacral practitioners are used to interact with slow waves inside our body and during their practice, they tend to recover lost of movement (fixed parts of the body) and lost of amplitude of these internal waves.
The wave which is most used by CranioSacral practitioners is about 6 cycles per minutes (so, at a frequency of about 0.1 Hz). The amplitude of this wave is a good indicator of the health condition of their patients. This relates the famous LF or low frequency component of HRV to the very important 0.1 Hz Mayer blood pressure wave.
Recently, Dan Winter demonstrate the link from this frequency of 0.1 HZ. Dan is suggesting that this precise frequency fits exactly the Caduceus cascade of phase conjugation initiating negentropic charge collapse (life). He shows this “ORIGIN OF BIOLOGIC NEGENTROPY” is all predicted by his new equation, golden ratio exponents/phase conjugation times plank length and time.
From Dan Winter’s book: Fractal Conjugate Space & Time: Cause of Negentropy, Gravity and Perception: Conjuring Life: “The Fractal Shape of TIME” Geometric Origins of Biologic Negentropy
Therefore this frequency around 0.1 hz is a vital wave influencing directly all the other waves of the body. This is the reason why this frequency is commonly used to pace breathing practice with biofeedback devices and also to train and measure heart coherence.
Breathing at this 0.1 Hz fixed frequency induces (by resonance) a bigger amplitude in your Heart Rate Variation (HRV) and in all your body waves (As waves are moving and waving within waves. Phase conjugation perfects this embedding/nesting/entanglement). This method gives very good results. But naturally, simple fixed frequencies are more enriched in real physiology.
The best way to amplify your own craniosacral wave is to be present and connect to yourself and surf on your own craniosacral wave. Learning to breath with your Mayer wave or cadduceus breath using iTHRVE is only the beginning.This is the most physiological way to entertain your vital waves and to boost your immune system. This will also regulate and synchronise your sympathetic systems resulting in reducing your stress.
Craniosacral app display VHLF
As the iTHRVE app displays your own craniosacral wave in real time, you can progressively train yourself to feel it and than interact with it… and became more and more present, connected to yourself and.. much less stressed.
What is craniosacral rhythm or wave?
CranioSacral” or “sacro cranial” wave is like a tide that craniosacral practitioners can feel all through the body. It is quite a slow rhythm wave of about 4 to 8 cycles per minute. This slow wave can be felt in the whole body, but also in each bone, in each muscle,… in each organ of the body.
In 1990, Daniel Fernandez (1), a french osteopath, was the first to demonstrate a relationship between the craniosacral wave and a blood pressure wave discovered by Siegmond Mayer which is usually called “Mayer wave” (originally defined as Traube–Hering–Mayer waves).
To be able to feel this very small pressure variation with their hands, craniosacral practitioners have to do a lot of practice to get confident with this very specific feeling. Using specialised blood pressure recordings gives, in this case, a very critical help in perceiving this.
Live recording of the blood pressure wave is not easy to achieve
- The most accurate way (but unfortunately an invasive way) is to place a needle in the blood vessel. This method can only be done in an hospital.
- Another way is to use a special armband connected to a printer. But this method only allows a continuous recording of about one minute. This was the way used by D. Fernandez in his publication (1) and this was the way that helped me to be confident with my manual palpation when I was a student.
- New devices are now available to measure these blood pressure variations, but these devices are quite expensive (2) (3) (4) (5).
A few years ago, thanks to the increasing power of computers and interfaces, I tried to develop a simple and cheap device that could display the Mayer pressure wave in real time. I achieved this on a PC with an earclip light sensor, and A/D interface:
Variations of the cardiac pulsations recorded by an auricle light sensor highlighting the Mayer wave oscillations (dark blue curve). The light blue curve represents the monitoring of the variations of the cardiac rhythm (HRV). It is observed that the variation of the Mayer wave does not necessary follow the variations of the heart rate (HRV).
Variations of the cardiac pulsations recorded by an auricle light sensor highlighting the Mayer wave oscillations (dark blue curve). The light blue curve represents the monitoring of the variations of the cardiac rhythm (HRV). It is observed that the variation of the Mayer wave does not necessary follow the variations of the heart rate (HRV).
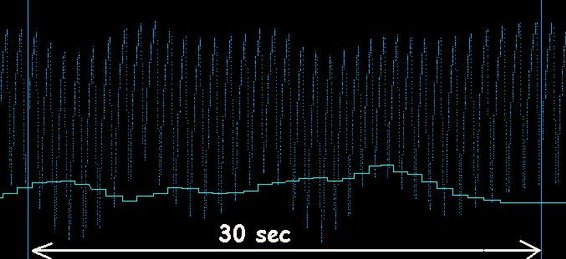
Recording of the cardiac Mayer wave (light blue curve). In yellow, the recording of the manual palpation. In dark blue, monitoring of respiration.
Recording of the cardiac Mayer wave (light blue curve). In yellow, the recording of the manual palpation. In dark blue, monitoring of respiration.
One can observe a good correlation between the upper part of the light blue curve and the manual palpation of the sacro-cranial wave (yellow curve). The lower part of the cardiac signal (light blue) follows respiration (dark blue).
The craniosacral wave is related to the yellow pressure curve.
Thanks to the increased power of iPhones and availability of new bluetooth sensors, it is now possible to create a new iPhone app allowing the CranioSacral wave display in real time*
* CranioSacral wave is a blood pressure wave and can only be displayed with light sensor like Camera or Finger Sensor
(can not be displayed with HRV sensors like Polar Chest Strap)
References
(1) D. FERNANDEZ, A. LECINE L’enregistrement de l’onde de Traube-Hering et de la palpation crânienne simultanée. Revue Ostéo n°9 – novembre 1990.
http://www.osteopathie-france.net/comprendre-losteopathie/osteo-cranien/616-cranien091
(2) KENNETH E. NELSON, DO; NICETTE SERGUEEF; CELIA M. LIPINSKI, MSII;ARINA R. CHAPMAN, MSII; THOMAS GLONEK, PhD Cranial rhythmic impulse related to the Traube-Hering-Mayer oscillation: comparing laser-Doppler flowmetry and palpation JAOA * Vol 101 * No 3 * March 2001 * 163
http://www.iahe.com/images/pdf/Traube.pdf
(3) Kenneth E. Nelson, DO, FAAO, FACOFP The Primary Respiratory Mechanism The AAO Journal Winter 2002, p24
https://www.researchgate.net/publication/266617625_The_primary_respiratory_mechanism
(4) Kenneth E. Nelson, DO; Nicette Sergueef, DO (France); Thomas Glonek, PhD Recording the Rate of the Cranial Rhythmic Impulse JAOA * Vol 106 * No 6 * June 2006 * 337-341
http://jaoa.org/article.aspx?articleid=2093282
(5) Continuous noninvasive arterial pressure
https://en.wikipedia.org/wiki/Continuous_noninvasive_arterial_pressure